a 40% json parsing speedup in apache pinot, found hiding in plain sight
how pre-production profiling revealed a two-line optimization that had been hiding behind three years of "good" refactors.
JSONMessageDecoder.decode() was parsing every message twice — once
into a Jackson JsonNode tree, then again into a Map. A two-line
change that binds the bytes directly to a Map via ObjectReader
produced 35–55% speedup on small/medium payloads and ~35–40% on large
payloads, translating to an estimated 3–5% reduction in overall
ingestion CPU across billions of daily events.
it started in preprod
StarTree maintains a pre-production environment that mirrors production ingestion patterns — similar Kafka topics, message rates, payload shapes. I do most of my profiling there before validating findings against production.
While analyzing flame graphs from a high-throughput JSON ingestion pipeline, I noticed
an unusual hotspot in RealtimeSegmentDataManager.consumeLoop() — the
critical path that processes every message from the stream.
The stack trace pointed to two methods in the JSON decoding path:
JsonUtils.bytesToJsonNode()JsonUtils.jsonNodeToMap()
At first glance, nothing unusual. But the CPU time told a different story: these two
methods together accounted for ~80% of the CPU time spent in
JSONMessageDecoder.decode(), and
decode() itself was ~30% of total ingestion CPU in preprod.
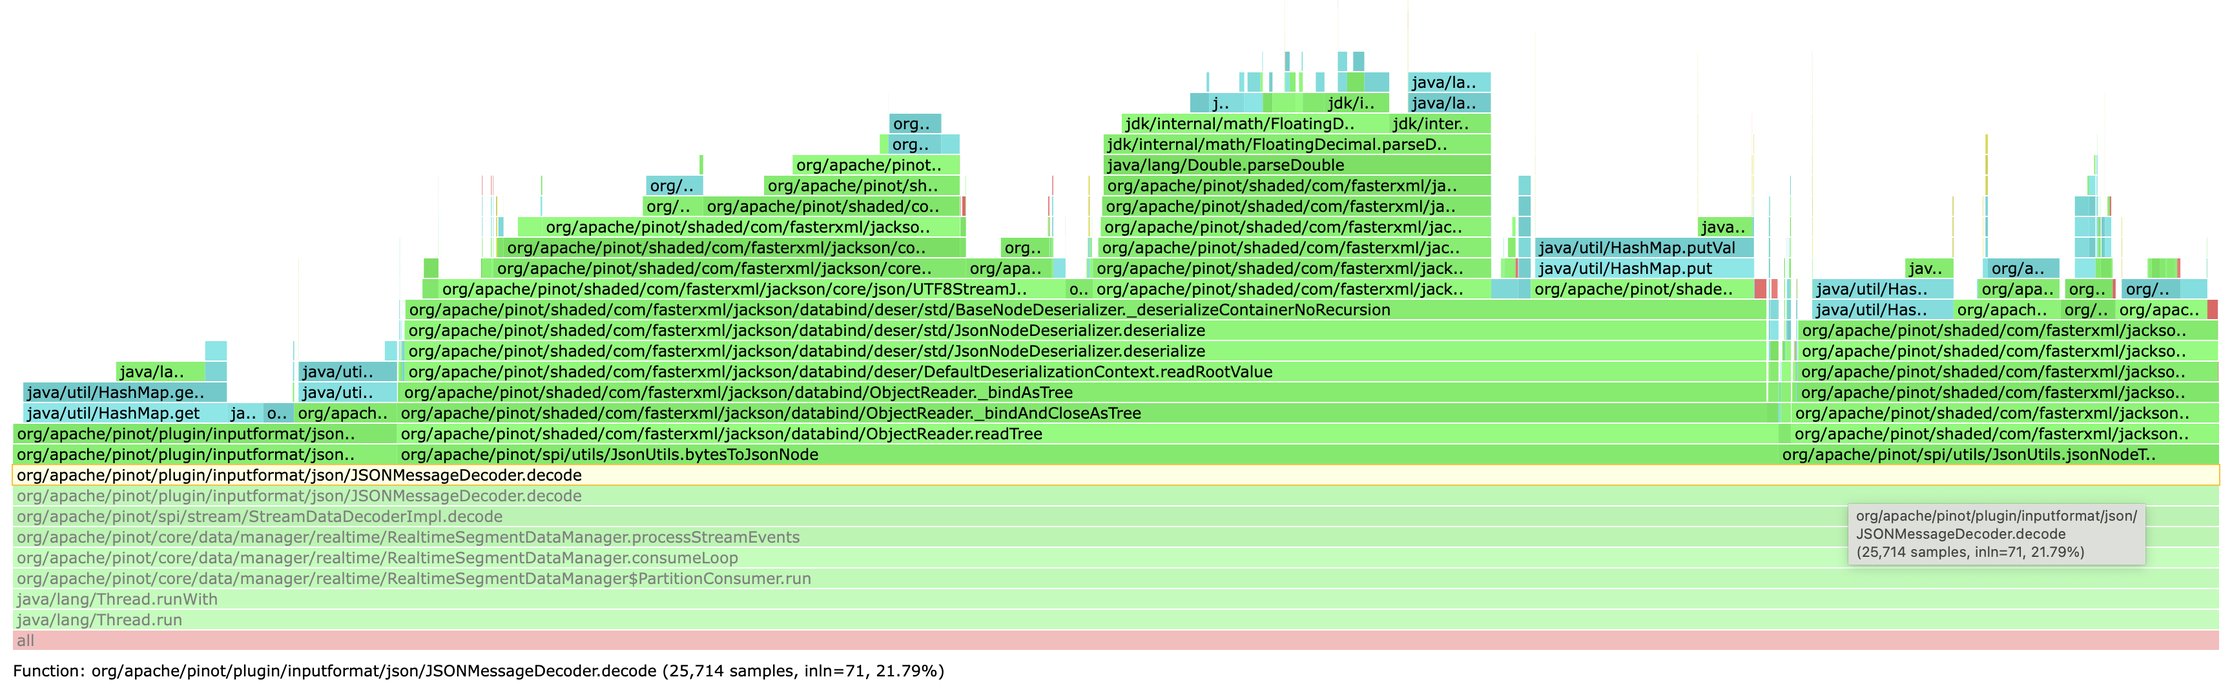
decode() ≈ 30% of ingestion cpu; bytesToJsonNode + jsonNodeToMap ≈ 80% of decode().validating in production
PreProd findings are hypotheses until confirmed. I pulled flame graphs from a production
cluster running a similar workload. Same pattern, same hotspot —
decode() was ~13% of overall ingestion CPU with the same two-method split.
This wasn't an artifact of the test environment.
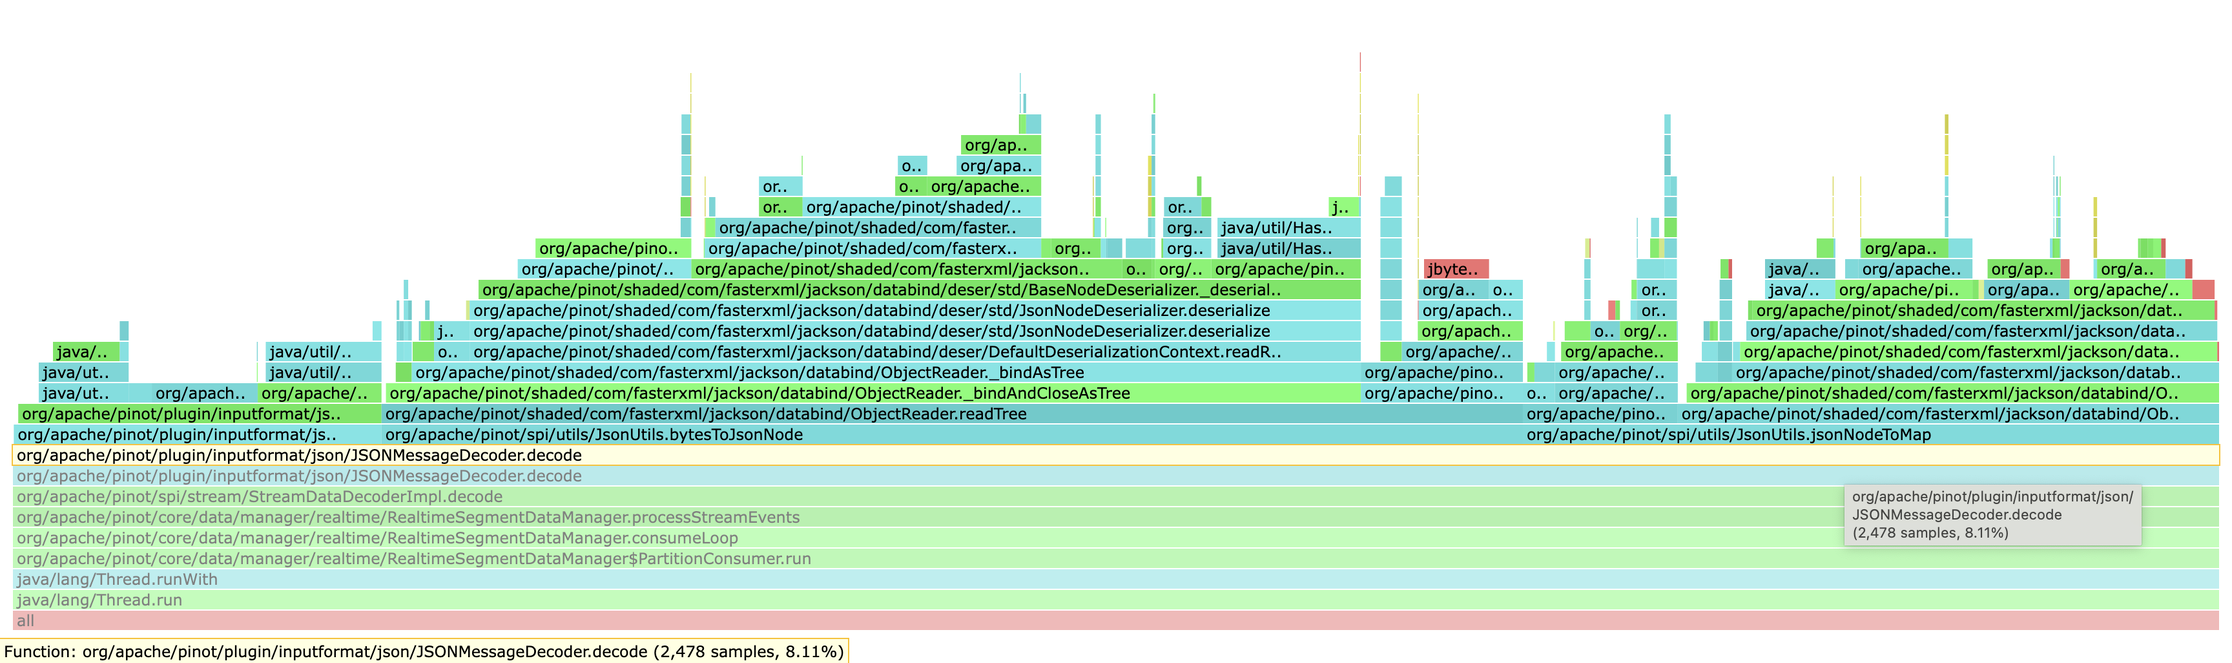
decode() ≈ 13% of ingestion cpu, 80% of it in the two parse methods.the anti-pattern: parsing json twice
Here's what was happening for every JSON message:
// Step 1: Parse bytes into Jackson's tree model
JsonNode message = JsonUtils.bytesToJsonNode(payload, offset, length);

// Step 2: Convert tree model into a Map
Map<String, Object> jsonMap = JsonUtils.jsonNodeToMap(message);
Two parsing phases. Two object-graph constructions. Double the allocations and GC pressure.
The pattern had evolved across multiple refactors over three years:
- 2022: centralized
ObjectMapperusage (good change, kept the pattern) - 2025: eliminated byte-array copies (good change, kept the pattern)
each refactor solved its own problem. none questioned the fundamental approach.
the fix
Jackson's ObjectReader can deserialize directly to a target type. No
intermediate tree needed:
public static Map<String, Object> bytesToMap(
        byte[] jsonBytes, int offset, int length) throws IOException {
    return DEFAULT_READER.forType(MAP_TYPE_REFERENCE)
        .readValue(jsonBytes, offset, length);
}
Two lines. That's the entire change.
why not jackson streaming api?
I benchmarked it. Streaming API is ~30% faster for tiny payloads (~100 bytes) but
converges to roughly the same performance for larger payloads (>1 KB). The reason is
that ObjectMapper's data binding already uses the Streaming API internally
— it just builds the Map for us. We're not bypassing streaming, we're
avoiding double-construction.
Other reasons for ObjectMapper: no maintenance burden (~100 lines of manual
parsing vs 1 line), automatic edge-case handling (BigDecimal, duplicate keys, etc.).
Streaming API shines when you're extracting a few fields from large documents — not this workload.
benchmark results
JMH microbenchmark with realistic payload profiles (before / after the fix):
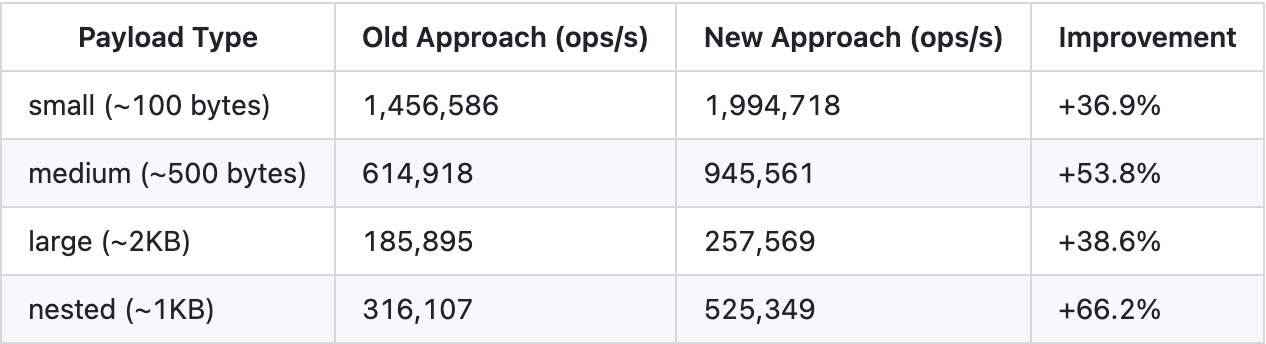
| payload profile | speedup |
|---|---|
| small to medium (most common in streaming) | 35–55% |
| large (~2 KB) | 35–40% |
Given decode()'s share of ingestion CPU, the expected impact on overall
ingestion is 3–5%. That sounds modest until you remember this code
runs across billions of daily events — the saved CPU cycles turn into real
capacity headroom: more throughput, fresher data, and infrastructure that breathes
easier under load.
takeaways
- invest in production-like preprod. being able to profile realistic workloads before touching production lets you iterate faster and with confidence.
- always validate in production. preprod findings are hypotheses; production confirms them.
- question inherited patterns. "we've always done it this way" isn't a reason. code that made sense years ago may not make sense today.
- the biggest wins are often the simplest. this wasn't a clever algorithm. it was recognizing we were doing the same work twice.
merged upstream: apache/pinot #17485 · full write-up: original linkedin article