uncovering 3 performance optimizations in apache pinot's protobuf ingestion
a customer flame graph at 2–3M events/sec surfaced a rocksdb cache miss, redundant field lookups in the hot path, and a 2.9× faster decoder most users don't know about.
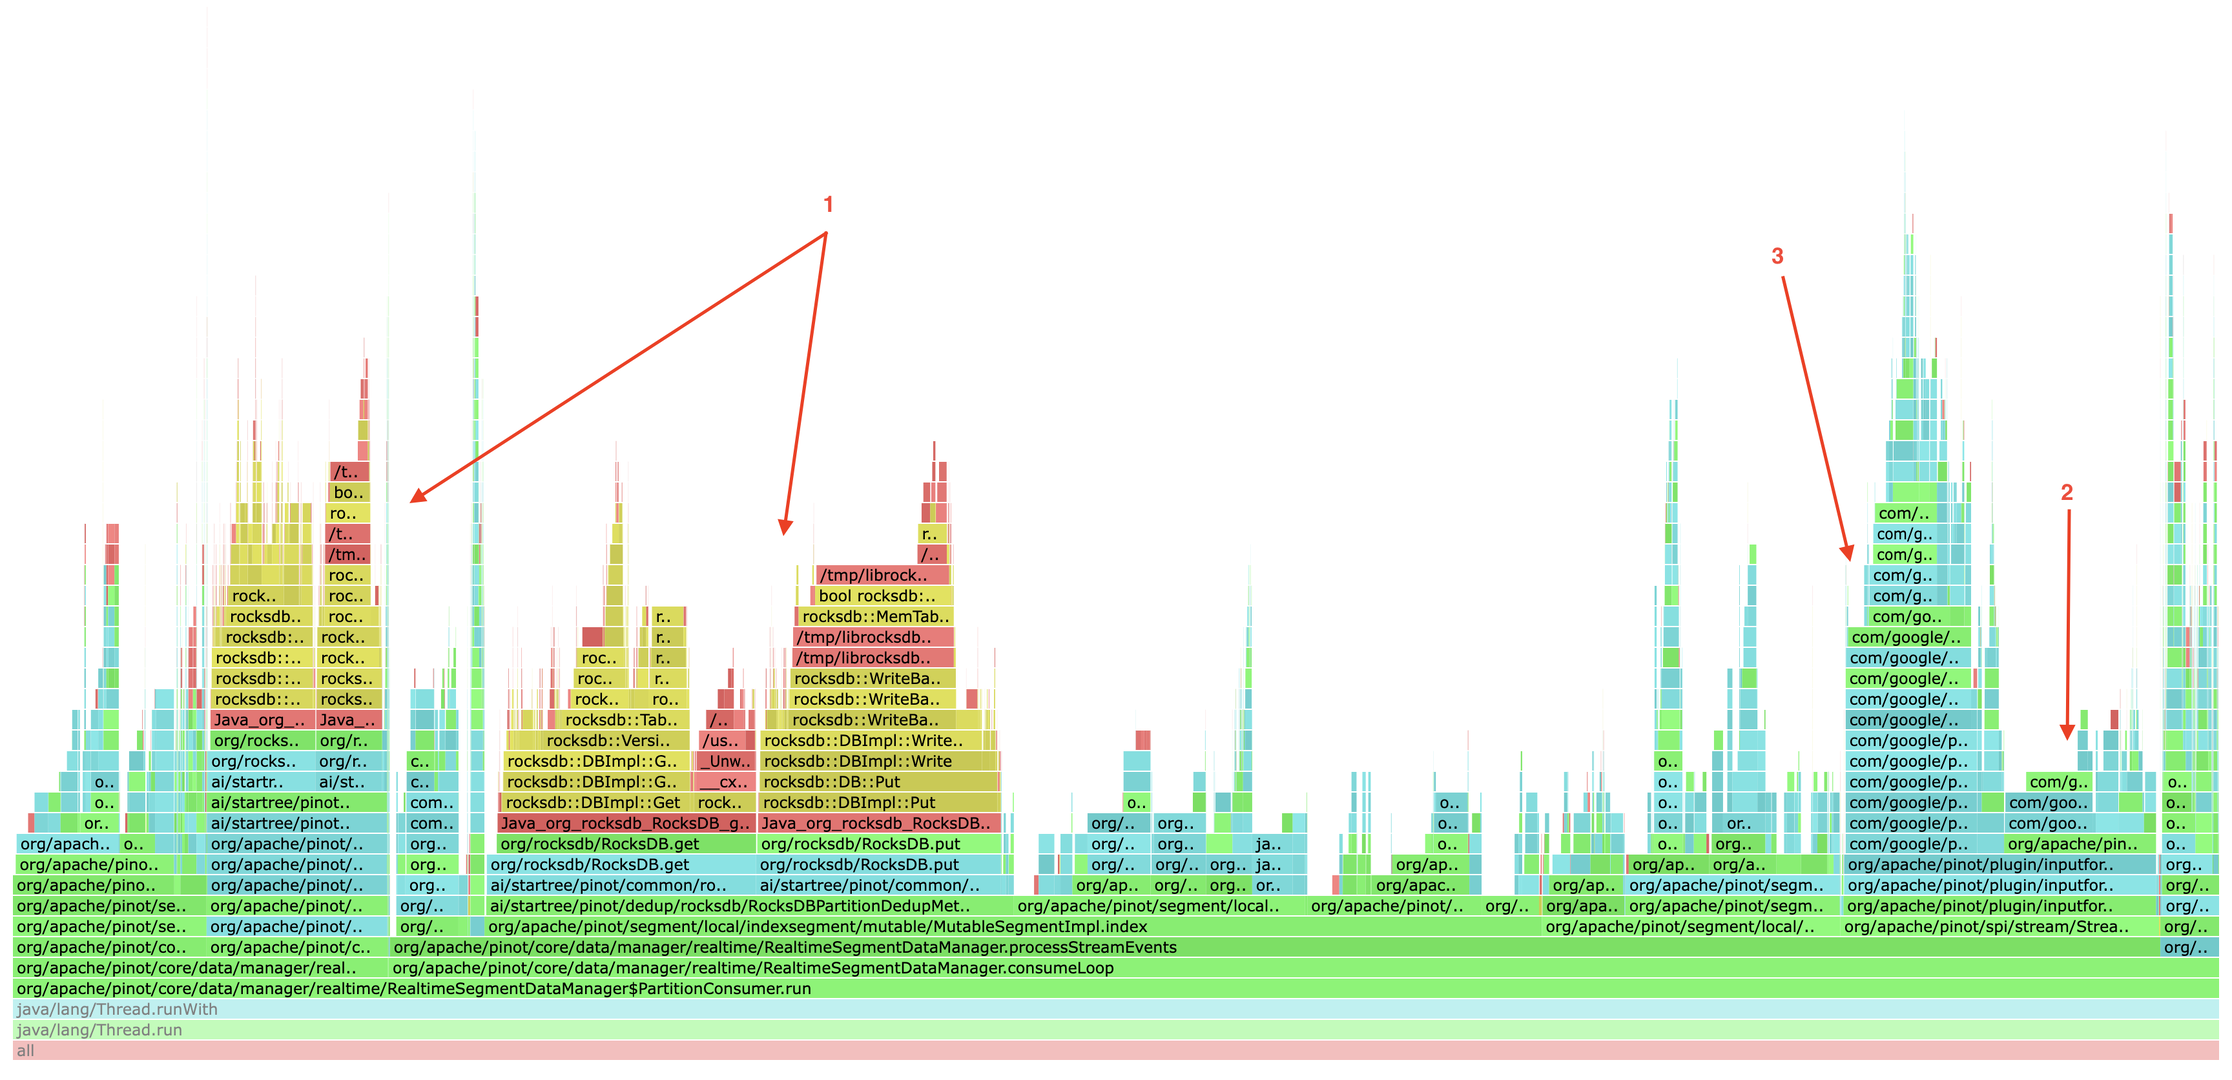
Three independent findings in a single customer flame graph, combining to an estimated 15–20% overall ingestion CPU reduction:
- rocksdb data-block cache — 90% hit rate was hiding a 10% miss rate on the dedup critical path · ~7.5–10% CPU
- protobuf field extraction —
findFieldByName()+ per-field allocation in a hot loop · up to 4× extractor speedup, ~0.6–2.1% ingestion CPU - dynamic vs code-gen decoder —
ProtoBufCodeGenMessageDecoderis 2.9× faster than the reflective default · ~6–7% ingestion CPU
it started in production
A customer was running a high-throughput protobuf ingestion pipeline on Pinot, processing roughly 2–3 million events per second at peak. While profiling their production Pinot servers, three independent hotspots stood out in the ingestion path:
- rocksdb operations —
RocksDB.get/RocksDB.putcalls used for dedup metadata - protobuf extraction —
ProtoBufRecordExtractor.extract()with repeatedfindFieldByName()calls - protobuf parsing —
DynamicMessage.Builder.mergeFrom()consuming significant CPU
get/put, ProtoBufRecordExtractor.extract(), and DynamicMessage.Builder.mergeFrom().finding #1 — rocksdb data-block cache miss
Digging into the RocksDB metrics for the dedup workload, I saw a split:
| metric | value | status |
|---|---|---|
| overall block cache hit rate | ~95% | healthy |
| data block cache hit rate | ~90% | lagging |
Overall looked fine, but the data block cache specifically was missing 10%
of the time. For a dedup workload where every ingested message triggers a
get/put, that 10% compounds fast. Each miss means:
- disk I/O or page cache lookup
- block decompression
- extra latency on the critical path
the fix
Increase the block cache size to drive the data block hit rate to 95%+. Expected impact:
- 10% → 5% miss rate = 50% fewer cache misses
- estimated rocksdb CPU reduction: 30–40%
- rocksdb = ~25% of overall ingestion CPU
- overall ingestion CPU reduction: ~7.5–10%
finding #2 — protobuf field extraction: the hidden redundancy
Looking at ProtoBufRecordExtractor.extract(), I noticed this running for
every field of every message:
// Called for EVERY message, EVERY field
Descriptors.FieldDescriptor fd = descriptor.findFieldByName(fieldName);
findFieldByName() is a HashMap lookup — fast in isolation.
But at 10+ fields × millions of messages/sec, it becomes measurable. Worse, a new
ProtoBufFieldInfo object was being allocated for every single field extracted:
// Before: new allocation per field
return new ProtoBufFieldInfo(value, fieldDescriptor);
the fix
- cache the field descriptors on the first message — reuse them for every subsequent message
- reuse a single
ProtoBufFieldInfoinstance instead of allocating per field
// After: cached array lookup + reusable object
_reusableFieldInfo.setFieldValue(value);
_reusableFieldInfo.setFieldDescriptor(cachedFieldDescriptors[i]);
benchmark — extract optimization (jmh)
| extraction pattern | speedup | est. overall ingestion CPU saved |
|---|---|---|
| all fields | 1.19× | ~0.6% |
| subset (5 fields, common in prod) | 3.5–4× | ~2.1% |
| single field | — | ~0.9% |
The biggest wins come from subset extraction — the common case in production where Pinot tables pull only a handful of fields from each protobuf message.
Status: merged upstream as apache/pinot #17593.
finding #3 — dynamicmessage: the real bottleneck
The biggest single CPU consumer was DynamicMessage.Builder.mergeFrom() —
the core protobuf parsing. This isn't a bug; it's inherent to how
DynamicMessage works. When you use .desc files with Pinot's
default ProtoBufMessageDecoder:
- every field access goes through reflection
- every message is stored in a generic
HashMapstructure - it works with any schema — but it's slow
the alternative: ProtoBufCodeGenMessageDecoder
Pinot has a lesser-known decoder —
ProtoBufCodeGenMessageDecoder —
that requires compiled protobuf classes (a .jar) but uses
runtime code generation via Janino for direct field access.
benchmark — dynamic vs code-gen (jmh)
| decoder | relative throughput |
|---|---|
ProtoBufMessageDecoder (reflective) | 1.00× |
ProtoBufCodeGenMessageDecoder | 2.8–2.9× |
For this customer's workload (protobuf decode ≈ 10% of ingestion CPU), switching could reduce overall ingestion CPU by 6–7%. Shared as a recommendation with the customer.
which decoder should you use?
| situation | recommendation |
|---|---|
only have .desc, want to avoid jar ops burden | ProtoBufMessageDecoder (with caching fix) |
| can compile protos to jar | ProtoBufCodeGenMessageDecoder |
| schema changes frequently | ProtoBufMessageDecoder (more flexible) |
| maximum throughput | ProtoBufCodeGenMessageDecoder |
putting it all together
Stacking the three findings — cache tuning, extractor caching, and decoder swap — puts ~15–20% of overall ingestion CPU on the table, depending on the customer's exact workload characteristics.
takeaways
- profile in production. test environments rarely show the full picture; real customer workloads reveal patterns synthetic tests can't produce.
- question the defaults. the default decoder was flexible and easy, but not fast. evaluate alternatives when performance matters.
- small inefficiencies compound. a HashMap lookup in nanoseconds becomes significant at millions of ops per second.
- look beyond the obvious. the rocksdb cache miss and the extractor overhead were hiding in plain sight — overshadowed by the more visible parsing cost.
merged upstream (finding #2): apache/pinot #17593 · full write-up: original linkedin article